
Introduction
Welcome to the comprehensive guide on basic statistics. In this article, we will explore the fundamental concepts of descriptive and inferential statistics, distributions, and hypothesis testing. Whether you're a student, researcher, or someone interested in understanding statistical concepts, this article will provide you with the necessary knowledge to grasp these topics effectively.

What is Statistics?
Statistics is a branch of mathematics and a scientific discipline that involves collecting, organizing, analyzing, interpreting, and presenting numerical data. It is used to gain insights, make informed decisions, and draw conclusions about various phenomena in the world.
At its core, statistics aims to understand and describe patterns and relationships within data. By studying statistical concepts, you can learn how to summarize large amounts of information into meaningful summaries, identify trends and patterns, and make reliable predictions or estimations.
Statistics can be referred to as "The Science in Data Science". It is widely used in various fields, including economics, psychology, biology, sociology, business, and many others. It provides a framework for understanding data and making objective decisions based on evidence rather than intuition.
As a beginner, it's important to familiarize yourself with basic statistical concepts, learn how to collect and organize data, and become comfortable with common statistical techniques. With practice and a solid foundation, you can develop the skills to analyze data effectively and make informed decisions in your area of interest.
Statistics can be broadly divided into two main categories: descriptive statistics and inferential statistics. 1) Descriptive & 2) Inferential Statistics.
Other 2 topics in the article are fundamentals of Distributions and Hypothesis Testing
Types of Data:
To start with, let us quickly understand 4 types of data. It is very important to examine the types of data to further understand the Distribution types and types of statistical analysis to be applied based on the data under study:
- Continuous data (Quantitative data that are the measured values generally represented on a continuous scale having infinite possible value between two values. Example - Temperature, Height, Weight etc)
- Discrete Data (Quantitative data which takes finite and discrete values. Example- employee headcount, Number of errors etc.)
- Nominal Data ( Qualitative Data used to label the variables which cannot be ordered and measured. Example, Male/Female, Color types, Regions, Countries etc)
- Ordinal Data ( Qualitative data that follows a definite order. Example - Survey scores etc.)
1. Descriptive Statistics
Descriptive statistics involves summarizing and describing data to gain insights and make sense of the information at hand.
1.1 What are Descriptive Statistics?
Descriptive statistics is a branch of statistics that focuses on summarizing and describing the main features of a dataset. It provides tools to analyze and interpret data by using various measures and graphical representations.
1.2 Measures of Central Tendency
Measures of central tendency help us understand the center or average of a dataset.
1.2.1 Mean
The mean is the arithmetic average of a set of values and is calculated by summing all the values and dividing by the total number of values. Mean gets affected by the presence of outliers in the dataset (Outliers are elements with either too high or too low value than the rest of the sample dataset)
1.2.2 Median
The median is the middle value of a dataset when it is arranged in ascending or descending order. Half the data items are below the median, and half above. Median is not affected by outliers unlike Mean.
1.2.3 Mode
The mode is the value that appears most frequently in a dataset.
1.3 Measures of Dispersion
Measures of dispersion provide information about the spread or variability of the data.
1.3.1 Range
The range is the difference between the maximum and minimum values in a dataset.
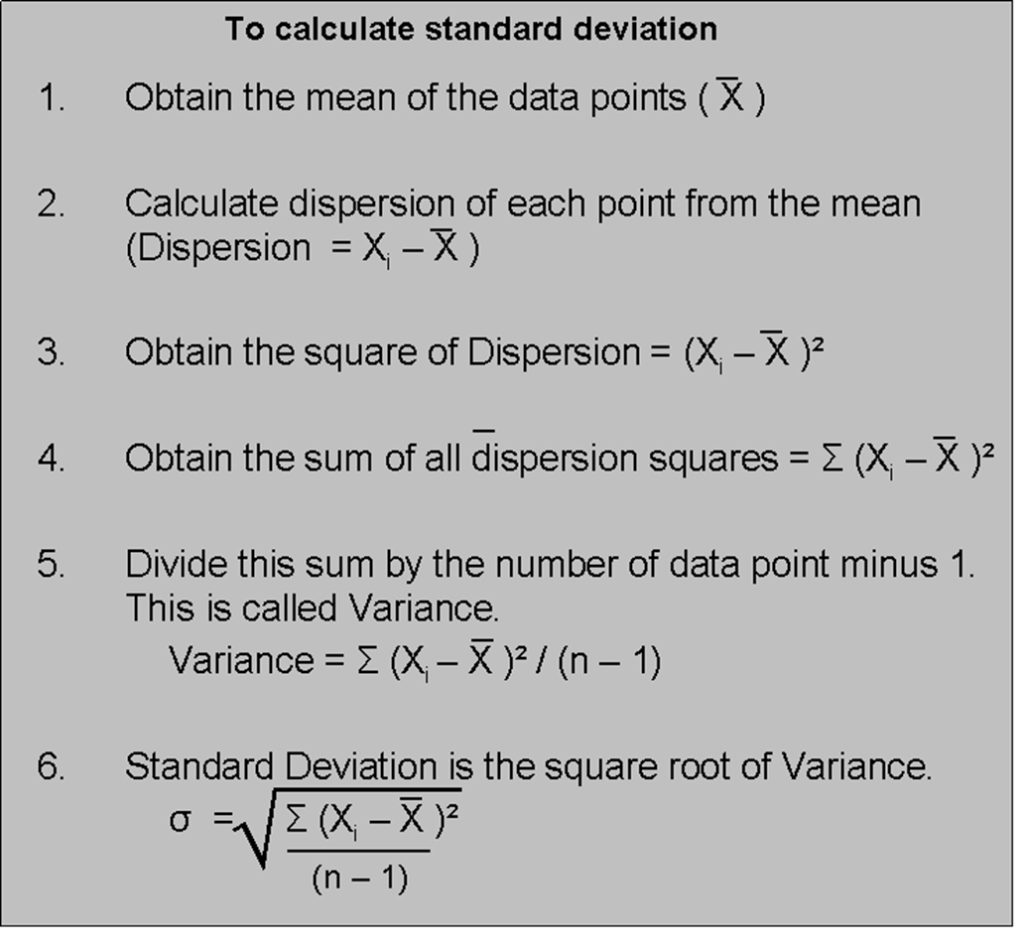
1.3.2 Variance
Variance measures the average squared deviation from the mean and indicates how much the data points differ from the mean.
1.3.3 Standard Deviation
The standard deviation is the square root of the variance and provides a measure of the dispersion of the data points around the mean.
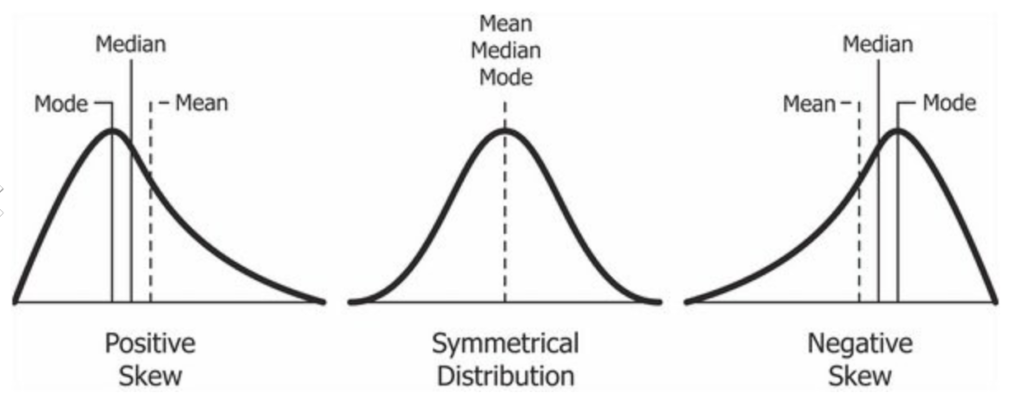
1.4 Skewness and Kurtosis
Skewness measures the asymmetry of a dataset. Types - Right/Positive skewed (Long tail on right side), Left/Negative skewed (Long tail on the left side)
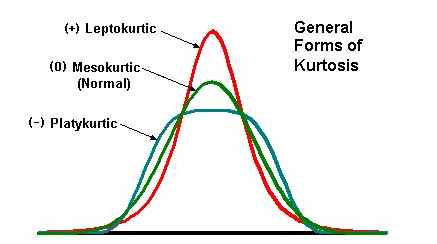
Kurtosis measures the peakedness or flatness of the distribution. Types - Platykurtic, MesoKurtic & Leptokurtic. Anormal Distribution has a Kurtosis value of 3
2. Inferential Statistics
Inferential statistics allows us to draw conclusions and make inferences about a population based on sample data.
2.1 What are Inferential Statistics?
Inferential statistics involves using sample data to make inferences or predictions about a population.
2.2 Sampling Techniques
Sampling techniques help in selecting representative samples from a population.
2.2.1 Random Sampling
Random sampling is a technique where each member of the population has an equal chance of being included in the sample.
2.2.2 Stratified Sampling
Stratified sampling involves dividing the population into subgroups or strata and then selecting samples from each stratum.
2.2.3 Cluster Sampling
Cluster sampling involves dividing the population into clusters or groups and then randomly selecting clusters for the sample (Notice the key difference with Stratified Sampling?)
2.3 Estimation and Confidence Intervals
Estimation involves using sample data to estimate population parameters, while confidence intervals provide a range of values within which the population parameter is likely to fall.
2.4 Hypothesis Testing
Hypothesis testing allows us to make decisions or draw conclusions about a population based on sample data.
2.4.1 Null Hypothesis
The null hypothesis represents the assumption of no effect or no difference in the population.
2.4.2 Alternative Hypothesis
The alternative hypothesis represents the opposite of the null hypothesis and suggests that there is an effect or a difference in the population.
2.4.3 Type I and Type II Errors
Type I error occurs when the null hypothesis isrejected when it is actually true, while Type II error occurs when the null hypothesis is accepted when it is actually false.
3. Distributions
Distributions provide a way to understand the patterns and characteristics of data.
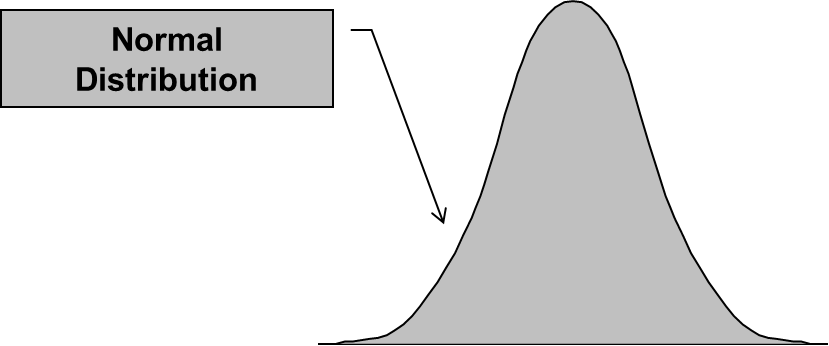
3.1 Normal Distribution
The normal distribution, also known as the Gaussian distribution, is a symmetric bell-shaped distribution that is commonly encountered in various fields. It has several properties that make it widely used in statistical analysis.
3.1.1 Properties of Normal Distribution
The normal distribution is characterized by its mean and standard deviation. It follows the 68-95-99.7 rule, also known as the empirical rule, which states that approximately 68%, 95%, and 99.7% of the data falls within one, two, and three standard deviations from the mean, respectively.
3.1.2 Z-Score
A Z-score, also known as a standard score, measures the number of standard deviations an observation or data point is from the mean of a distribution. It allows us to compare and standardize data across different distributions.
Z = ( x̅ – μ0 ) / (σ /√n)
- Here, x̅ is the sample mean,
- μ0 is the population mean,
- σ is the standard deviation,
- n is the sample size.
3.2 Binomial Distribution
The binomial distribution is a discrete probability distribution that models the number of successes in a fixed number of independent Bernoulli trials, where each trial has two possible outcomes: success or failure.
3.2.1 Properties of Binomial Distribution
The binomial distribution is characterized by two parameters: the number of trials (n) and the probability of success (p). It has properties such as a fixed number of trials, independent trials, and two possible outcomes.
3.2.2 Binomial Probability Formula
The probability of obtaining exactly k successes in n trials can be calculated using the binomial probability formula.
3.3 Poisson Distribution
The Poisson distribution is a discrete probability distribution that models the number of events that occur in a fixed interval of time or space, given the average rate of occurrence.
3.3.1 Properties of Poisson Distribution
The Poisson distribution is characterized by a single parameter, the average rate of occurrence (λ). It has properties such as independence of events and a constant average rate.
3.3.2 Poisson Probability Formula
The probability of observing k events in a given interval can be calculated using the Poisson probability formula.
*We will cover the topic of Statistical distributions in detail in a separate article in future.
4. Hypothesis Testing
Hypothesis testing is a statistical method used to make decisions or draw conclusions about a population based on sample data. The experimenter collects data for a particular study and makes some assumptions (called Hypothesis - Null & Alternate hypothesis). Based on the results of the hypothesis test, Null hypothesis is either rejected or accepted leading to the conclusion about the study.
4.1 Steps in Hypothesis Testing
Hypothesis testing involves several steps to ensure a systematic and valid analysis.
4.1.1 Formulating the Hypotheses
The first step in hypothesis testing is to clearly define the null hypothesis and alternative hypothesis based on the research question.
For example, if the objective is to study the impact of the performance improvement initiatives on your team, you would have collected performance data before and after the initiatives.
Null hypothesis would be that there is not statistically significant difference in performance
Alternate hypothesis would be that there is a statistically significant difference in before and after performance.
4.1.2 Choosing the Significance Level
The significance level, denoted by α (alpha), determines the probability of making a Type I error. It is typically set at 0.05.
4.1.3 Collecting Data
In this step, data is collected from a sample or samples that are representative of the population of interest.
4.1.4 Calculating Test Statistic
A test statistic is calculated based on the sample data and the specific hypothesis test being conducted. Based on the type of the data collected and number of variables involved, a hypothesis test is conducted. For example, z-statistic, t-statistic, chi-square statistic are calculated depending on the hypothesis test being conducted
4.1.5 Making a Decision
The decision-making step involves comparing p-value determined by the calculated test statistic with the critical significance value(s) to determine whether to reject or fail to reject the null hypothesis. If p-value is less than the significance level (α), the null hypothesis is rejected. Rejection of null hypothesis implies that Alternate hypothesis is accepted which means there is statistically significant difference between before and after variable data.
4.2 Types of Hypothesis Tests
There are various types of hypothesis tests, each suitable for different scenarios and research questions. Some of them are listed below, there are many more (to be covered in detail in a dedicated article on Hypothesis Testing)
4.2.1 One-Sample t-test
The one-sample t-test is used to compare the mean of a single sample with a known or hypothesized population mean.
4.2.2 Independent Samples t-test
The independent samples t-test is used to compare the means of two independent samples and determine if they are significantly different from each other.
4.2.3 Paired Samples t-test
The paired samples t-test is used to compare the means of two related or paired samples, such as before and after measurements.
4.3 Interpreting Hypothesis Test Results
Interpreting the results of a hypothesis test involves considering the p-value, confidence intervals, and effect size.
4.3.1 P-Value
The p-value is the probability of obtaining the observed data or more extreme results, assuming the null hypothesis is true. It is compared to the significance level to determine statistical significance as explained in the hypothesis testing section above.
4.3.2 Type 1 and Type 2 Error
A hypothesis test can result in two types of errors.
Type I Error: A Type-I error occurs when sample results reject the null hypothesis despite being true.
Type II Error: A Type-II error occurs when the null hypothesis is not rejected when it is false, unlike a Type-I error.
4.3.3 Confidence Intervals
Confidence intervals provide a range of values within which the population parameter is likely to fall with a certain level of confidence.
Conclusion
In conclusion, understanding basic statistics is crucial for analyzing and interpreting data in various fields. Descriptive statistics allows us to summarize and describe data, while inferential statistics enables us to make inferences and draw conclusions about populations based on sample data. Distributions provide insights into the patterns and characteristics of data, and hypothesis testing allows us to make decisions and test research hypotheses. By familiarizing yourself with these fundamental concepts, you will be equipped with the necessary statistical knowledge to make informed decisions and contribute to evidence-based practices in your field. Statistical expertise is an important ingredient if you are targeting to move in the field of Data Science and Artificial Intelligence.
Happy Learning!!
2 thoughts on “Statistics made easy – Basic statistics fundamentals 101”