
In today's data-driven world, statistical analysis plays a vital role in extracting valuable insights from raw data. By applying various statistical techniques and methods, businesses and researchers can gain a deeper understanding of patterns, trends, and relationships within their data. Moreover, data reconfiguration enables the restructuring and transformation of data, allowing for more meaningful analysis. In this article, we will explore the importance of statistical analysis and data reconfiguration and how they contribute to informed decision-making. This article will be helpful specially for the beginners who are trying to explore the field and need to understand some key concepts.
Introduction: Unleashing the Power of Statistical Analysis and Data Reconfiguration
Organizations and researchers encounter vast amounts of information that can be overwhelming to interpret and utilize effectively. This is where statistical analysis and data reconfiguration come into play. By employing statistical techniques and restructuring data, decision-makers can uncover valuable insights and make informed choices.
1. The Role of Statistical Analysis in Data Interpretation
Descriptive Statistics: Summarizing and Exploring Data
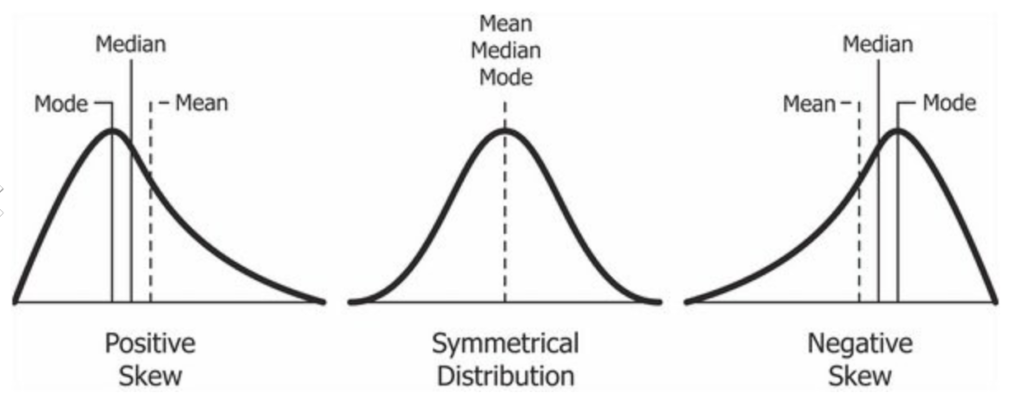
Descriptive statistics provides a snapshot of the main characteristics of a dataset. It involves summarizing data through measures such as central tendency (mean, median, mode) and dispersion (range, variance, standard deviation). By utilizing descriptive statistics, analysts can gain an overview of the dataset, identify outliers, and detect patterns.
Inferential Statistics: Drawing Conclusions and Making Predictions
Inferential statistics enables analysts to draw conclusions and make predictions about a larger population based on a sample. It involves hypothesis testing, confidence intervals, and regression analysis. By employing inferential statistics, decision-makers can make data-driven inferences and predictions that are representative of the population.
Hypothesis Testing: Validating Assumptions and Claims
Hypothesis testing is a vital aspect of statistical analysis. It allows researchers to test assumptions and claims on the large population based on available sample data. By formulating a null hypothesis and an alternative hypothesis, analysts can determine the validity of a claim and make decisions accordingly. Hypothesis testing provides a framework for assessing the significance of findings. (One key concept to understand here is p-value). Some examples of Hypothesis tests are z-test, t-test, F-test, chi-square test, ANOVA and many more, which are used based on the type of data (continuous or categorical data) involved.
2. Key Statistical Techniques for Data Analysis
Regression Analysis: Understanding Relationships and Dependencies
Regression analysis is perhaps the most popular and widely used statistical data analysis. It involves the exploration of the relationship between a dependent variable and one or more independent variables. It helps in understanding how changes in one variable affect another. Regression analysis is valuable for predicting outcomes and uncovering associations, allowing decision-makers to make informed choices based on the observed relationships. Few important types are Linear Regression, Multiple Regression, Logistic Regression, etc. (These are topics for some other article dedicated article on regression Analysis)
Analysis of Variance (ANOVA): Comparing Multiple Groups
ANOVA is a statistical hypothesis testing technique used to compare the means of two or more groups. It assesses whether there are significant differences among the groups being compared. ANOVA is commonly used in experimental and research settings to analyze data with multiple categorical or continuous independent variables.
Time Series Analysis: Unveiling Temporal Patterns
Time series analysis involves analyzing data collected over regular time intervals to identify patterns and trends. It is frequently used in forecasting future values based on historical data. Time series analysis helps decision-makers understand the dynamics and behavior of data over time, enabling them to make predictions and strategic decisions.
Cluster Analysis: Identifying Similar Patterns and Groups
Cluster analysis is a technique used to group similar objects or data points together based on their characteristics or similarities. It helps identify underlying structures and patterns within a dataset. Cluster analysis is valuable in market segmentation, customer profiling, and anomaly detection, allowing organizations to tailor their strategies and offerings.
3. Data Reconfiguration: Preparing Data for Analysis
Data Cleaning: Removing Errors, Outliers, and Inconsistencies
No data analysis is useful unless it is free of errors and inconsistencies. Data cleaning is a crucial step in data analysis. It involves identifying and rectifying errors, outliers, and inconsistencies in the dataset. By ensuring data integrity, decision-makers can avoid biased or misleading results and make accurate conclusions based on reliable information. Almost 70-80% of efforts spend on any data analysis project is spend on Data collection and cleaning which highlights the importance of this step.
Data Transformation: Normalizing and Standardizing Variables
In any medium to large data analysis project, there are many variables on which data is collected and analyzed. These variable are usually not "normally" distributed. Data transformation involves modifying variables to meet certain assumptions or to improve the quality of analysis. It includes techniques such as normalization, standardization, and logarithmic transformation. Data transformation helps to make variables comparable and reduces the impact of extreme values, enhancing the accuracy of statistical models. (To carry out proper data transformations, it is essential to understand various types of "Data Distributions" (like Normal Distribution, Logistics Distribution, Logarithmic Distribution etc)
Feature Engineering: Creating New Variables and Indicators
Feature engineering is the process of creating new variables or indicators from existing data. It involves extracting meaningful information or patterns that might not be directly available in the original dataset. Feature engineering helps to enhance the predictive power of statistical models and uncover hidden insights within the data. Some techniques used are - Feature Extraction, Feature scaling, Binning, Interaction features etc..
4. Tools and Software for Statistical Analysis and Data Reconfiguration
To facilitate statistical analysis and data reconfiguration, various tools and software are available. Some of the most popular are listed below:
Statistical Packages: SPSS, R, Python
Statistical packages such as SPSS, R, and Python offer a wide range of statistical functions and tools for data analysis. These packages provide a user-friendly interface and comprehensive libraries that support various statistical techniques. They enable analysts to perform complex analyses efficiently and generate meaningful results.
Data Visualization Tools: Tableau, Power BI
Data visualization tools like Tableau and PowerBI allow analysts to create visually appealing and interactive charts, graphs, and dashboards. These tools enable the exploration and presentation of data in a comprehensible manner. With their intuitive interfaces and drag-and-drop functionality, decision-makers can gain insights from complex datasets and communicate findings effectively.
5. The Importance of Domain Knowledge in Statistical Analysis
While statistical analysis provides valuable insights, it is essential to combine it with domain knowledge. Understanding the context and variables involved in the analysis is crucial for accurate interpretation. Domain knowledge allows analysts to identify relevant factors, validate assumptions, and apply appropriate statistical techniques. By integrating statistical expertise with domain knowledge, decision-makers can make informed decisions that align with the specific requirements of their industry or field.
6. Real-World Applications of Statistical Analysis and Data Reconfiguration
Statistical analysis and data reconfiguration are applied in wide range of domains and industries. Here are some examples:
Business Analytics: Optimizing Operations and Strategies
Businesses leverage statistical analysis to optimize operations, improve customer satisfaction, and streamline processes. By analyzing sales data, customer behavior, and market trends, businesses can identify patterns and make data-driven decisions. Statistical techniques help in demand forecasting, pricing optimization, and identifying growth opportunities.
Healthcare Research: Identifying Risk Factors and Treatment Efficacy
In healthcare research, statistical analysis plays a critical role in analyzing patient data, clinical trials, and epidemiological studies. It helps identify risk factors for diseases, evaluate treatment efficacy, and assess the impact of interventions. Statistical techniques enable researchers to draw meaningful conclusions and contribute to evidence-based medicine.
Social Sciences: Analyzing Surveys and Public Opinion
In social sciences, statistical analysis is used to analyze survey data, conduct experiments, and study public opinion. Researchers utilize statistical techniques to uncover patterns, trends, and correlations in human behavior, attitudes, and preferences. By applying statistical methods, social scientists gain insights into societal trends, political preferences, and public sentiment.
Challenges and Considerations in Statistical Analysis and Data Reconfiguration
Statistical analysis and data reconfiguration come with certain challenges that analysts need to address:
Sampling Bias and Non-Representative Data
Sampling bias occurs when the selected sample does not accurately represent the target population. This can lead to misleading or biased results. Analysts need to carefully design sampling strategies to ensure data representativeness and mitigate potential biases. Sampling is altogether a huge topic and it needs to be paid proper attention while designing the data collection strategies.
Missing Data and Incomplete Observations
In real-world datasets, missing data and incomplete observations are common. Analysts must handle missing data appropriately to avoid biased results. Imputation techniques, such as mean imputation or regression imputation, can be employed to estimate missing values while preserving the integrity of the analysis.
Overfitting and Underfitting Statistical Models
Overfitting occurs when a statistical model is too complex and fits the training data too closely, leading to poor generalization on new data. Underfitting, on the other hand, happens when a model is too simplistic and fails to capture the underlying patterns. Balancing model complexity and generalizability is crucial for accurate analysis and prediction.
Conclusion: Empowering Decision-Makers with Statistical Insights
Statistical analysis and data reconfiguration are indispensable tools for unlocking insights from data and empowering decision-makers. By employing descriptive and inferential statistics, conducting hypothesis testing, and utilizing various statistical techniques, decision-makers can make informed choices based on evidence and data-driven insights. Additionally, proper data reconfiguration ensures data quality, enhances analysis accuracy, and enables effective decision-making.
Unlock the power of statistical analysis and data reconfiguration to transform raw data into actionable insights that drive success and innovation in today's data-centric world.
This is a very huge topic to be covered in a small article. This article is a very humble attempt to introduce some key concepts in statistical analysis. There are many more which needs to be understood by people interested in this area. Even the above mentioned topics are to be explored in more detail.
FAQs (Frequently Asked Questions)
- What is the difference between descriptive and inferential statistics? Descriptive statistics focuses on summarizing and exploring data, providing a snapshot of its main characteristics. Inferential statistics, on the other hand, involves drawing conclusions and making predictions about a larger population based on a sample.
- How can data reconfiguration improve the quality of analysis? Data reconfiguration involves cleaning, transforming, and engineering data to ensure its integrity and enhance the accuracy of statistical analysis. By removing errors, standardizing variables, and creating new indicators, data reconfiguration improves the quality of insights derived from the analysis.
- Which statistical software is best for beginners? For beginners, statistical software like SPSS, R, and Python provide user-friendly interfaces and comprehensive libraries for statistical analysis. These tools offer extensive documentation and online resources, making them accessible to users with varying levels of expertise.
- What are some common challenges in statistical analysis? Common challenges in statistical analysis include sampling bias, missing data, and the risk of overfitting or underfitting statistical models. Addressing these challenges requires careful consideration of data collection methods, appropriate handling of missing data, and finding the right balance between model complexity and generalizability.
- Can statistical analysis be applied to non-numerical data? Yes, statistical analysis can be applied to non-numerical data through techniques such as categorical data analysis, qualitative data analysis, and text mining. These methods allow for meaningful analysis and inference from data in various formats.
https://vipblog10.com/wp-admin/post.php?post=1753&action=edit